YOU CAN CODE!


With The Case Of UCanCode.net  Release The Power OF  Visual C++ !   HomeProducts | PurchaseSupport | Downloads  
Download Evaluation
Pricing & Purchase?
E-XD++Visual C++/ MFC Products
Overview
Features Tour 
Electronic Form Solution
Visualization & HMI Solution
Power system HMI Solution
CAD Drawing and Printing Solution

Bar code labeling Solution
Workflow Solution

Coal industry HMI Solution
Instrumentation Gauge Solution

Report Printing Solution
Graphical modeling Solution
GIS mapping solution

Visio graphics solution
Industrial control SCADA &HMI Solution
BPM business process Solution

Industrial monitoring Solution
Flowchart and diagramming Solution
Organization Diagram Solution

Graphic editor Source Code
UML drawing editor Source Code
Map Diagramming Solution

Architectural Graphic Drawing Solution
Request Evaluation
Purchase
ActiveX COM Products
Overview
Download
Purchase
Technical Support
  General Q & A
Discussion Board
Contact Us

Links

Get Ready to Unleash the Power of UCanCode .NET


UCanCode Software focuses on general application software development. We provide complete solution for developers. No matter you want to develop a simple database workflow application, or an large flow/diagram based system, our product will provide a complete solution for you. Our product had been used by hundreds of top companies around the world!

"100% source code provided! Free you from not daring to use components because of unable to master the key technology of components!"


GDI+ Examples: Drawing Column Chart


Column Chart

Introduction


A chart is a technique of representing numeric values using colored shapes. The shape(s) can be geometric or not. To draw such a chart, you can use your knowledge of GDI+ techniques. In this exercise, we use the Graphics::DrawRectangle() method to draw a series of rectangles that represent a column chart.


Practical LearningPractical Learning: Creating the Chart

 
  1. Start a new Windows Forms Application named WeeklySales1
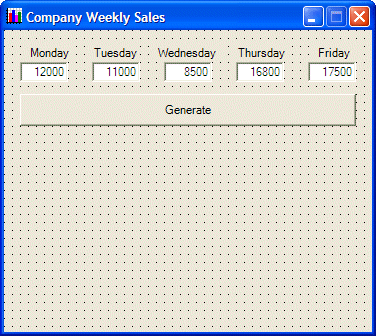
  2. Design the form as follows:
     
  3. Right-click the form and click View Code and declare the following two variables:
     
    private:
    	/// <summary>
    	/// Required designer variable.
    	/// </summary>
    	System::ComponentModel::Container ^components;
    	Graphics ^ graphDrawingArea;
    	Bitmap   ^ bmpDrawingArea;
  4. Return to the form
  5. Double-click an unoccupied area on the form and implement its Load event as follows:
     
    System::Void Form1_Load(System::Object^  sender, System::EventArgs^  e)
    {
    	 bmpDrawingArea   = gcnew Bitmap(Width, Height);
    	 graphDrawingArea = Graphics::FromImage(bmpDrawingArea);
    }
  6. Return to the form and click an empty area on it. In the Properties window, click the Events button Events
  7. Double-click the Paint field and implement its event as follows:
     
    System::Void Form1_Paint(System::Object^  sender, 
    	System::Windows::Forms::PaintEventArgs^  e)
    {
    	 e->Graphics->DrawImage(bmpDrawingArea, 0, 0);
    }
  8. Return to the form
  9. Double-click the Generate button and implement its Click event as follows:
     
    System::Void btnGenerate_Click(System::Object^  sender,
    				 System::EventArgs^  e)
    {
    	 double monday = double::Parse(this->txtMonday->Text) / 100;
    	 double tuesday = double::Parse(this->txtTuesday->Text) / 100;
    	 double wednesday = double::Parse(this->txtWednesday->Text) / 100;
    	 double thursday = double::Parse(this->txtThursday->Text) / 100;
    	 double friday = double::Parse(this->txtFriday->Text) / 100;
    
    	 graphDrawingArea->Clear(this->BackColor);
    
    	 graphDrawingArea->FillRectangle(gcnew SolidBrush(Color::Red),       
    					 this->txtMonday->Left+5,    
    					 280-monday,    40, monday);
    	 graphDrawingArea->DrawRectangle(gcnew Pen(Color::Black),            
    					 this->txtMonday->Left+5,    
    					 280-monday,    40, monday);
    	 graphDrawingArea->FillRectangle(gcnew SolidBrush(Color::Blue),      
    					 this->txtTuesday->Left+5,   
    					 280-tuesday,   40, tuesday);
    	 graphDrawingArea->DrawRectangle(gcnew Pen(Color::Black),            
    					 this->txtTuesday->Left+5,   
    					 280-tuesday,   40, tuesday);
    	 graphDrawingArea->FillRectangle(gcnew SolidBrush(Color::Fuchsia),   
    					 this->txtWednesday->Left+5, 
    					 280-wednesday, 40, wednesday);
    	 graphDrawingArea->DrawRectangle(gcnew Pen(Color::Black),            
    					 this->txtWednesday->Left+5, 
    					 280-wednesday, 40, wednesday);
    	 graphDrawingArea->FillRectangle(gcnew SolidBrush(Color::Brown),     
    					 this->txtThursday->Left+5,  
    					 280-thursday,  40, thursday);
    	 graphDrawingArea->DrawRectangle(gcnew Pen(Color::Black),            
    					 this->txtThursday->Left+5,  
    					 280-thursday,  40, thursday);
    	 graphDrawingArea->FillRectangle(gcnew SolidBrush(Color::Turquoise), 
    					 this->txtFriday->Left+5,    
    					 280-friday,    40, friday);
    	 graphDrawingArea->DrawRectangle(gcnew Pen(Color::Black),            
    					 this->txtFriday->Left+5,    
    					 280-friday,    40, friday);
    
    	 graphDrawingArea->DrawRectangle(gcnew Pen(Color::Black), 
    					 10, 280, Width - 30, 1);
    	 Invalidate();
    }
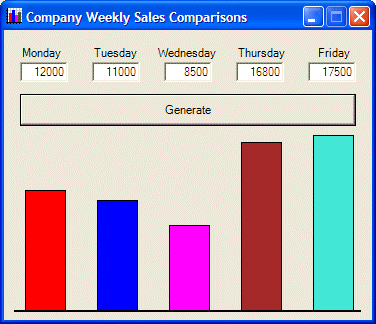
  10. Execute the application and test the form
     
     Column Chart
  11. After using it, close the form


Copyright ?1998-2022 UCanCode.Net Software , all rights reserved.
Other product and company names herein may be the trademarks of their respective owners.

Please direct your questions or comments to webmaster@ucancode.net