| |
|
This solution uses a
completely open organization, will create a cutting
instrument is divided into: the instrument panel,
the pointer, measurement scale and background of
several parts, these parts not only interrelated,
but also fully independent, as when creating a new
instrument, based on need to be any combination of,
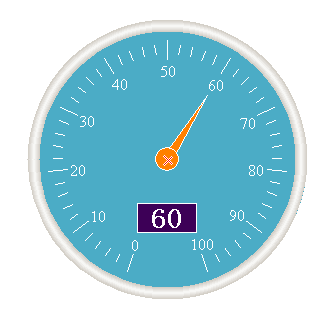
for example, dashboarisk scale + Triangle + oval
pointer, you can build the following instruments:
UCanCode
Meters anials instrument
graphics
are drawn by a team of flexibility and show the
progress of the class composition of these classes
with flexible design, each part can be flexibly
customized. Mainly consists of three parts:
(Note:
The instrumentation component modules in the
Advanced Enterprise version
only available!)
1) Background: UCanCode
instruments directly from any of the
background graphic E-XD++
component library visual
graphics
to form the ready-made
graphics
class, you can use any E-XD++
component library
visual
graphics as the
background graphics class such as lines \
Rectangular \ oval \ images \ arc \ complex
graphics
and so on. If you choose any graphic type as the
background, the instrumentation will UCanCode
graphics derived from this class, for example,
derived from CFOButtonShape, the instrument
background is a rectangular button.
2) Scale:
UCanCode meter scale instrumentation provides a
default linear scale and the scale of the two
elliptical arc, you can have either, or derived from
these two species as to create a new scale type, in
use time, need to refer to sample program to paste
together with the background
graphics.
3)
Pointer: UCanCode pointer instrument
graphics can be very
broad, you can make rectangular progress bar \ the
linear pointer \ arc pointer \ digital indicators,
etc., in use, how much pointer, the pointer will be
the number of background graphics pasted together
with the can be. as shown, and some at the same time
both the linear pointer anigital indicators.
while the pointer class itself is completely
derived. If you need to customize the pointer, only
need to derive from the corresponding class can be
completed.
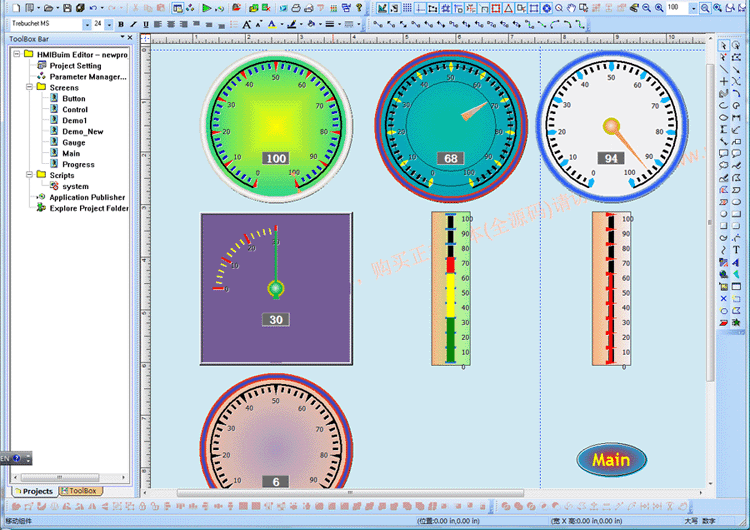
The following is
HMIBuilder
instrumentation solutions Case:
E-XD++
products, our pre-scheduled in the CFODrawShape
several base class to deal specifically with the
virtual instrument graphical function of the
coverage of these virtual functions and pointers can
be equal to the background scale associate.
1.
The
default scale bar:
1). CFOPMeterScale
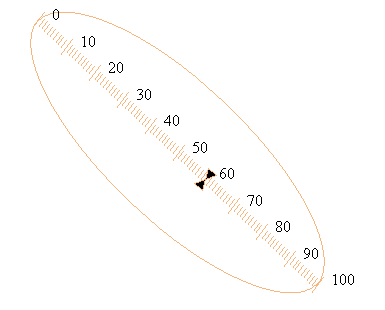
Class
CFOPMeterScale
defines a
linear scale, through the property to set Minimum
and Maximum properties of maximum and minimum
values, as shown above.
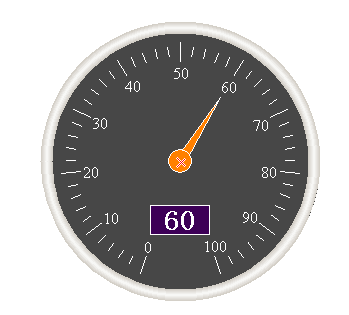
2).
CFOPMeterEllipticalScale
Another
scale category is
CFOPMeterEllipticalScale, is a scale along the
ellipse. Can set StartAngle and SweepAngle.
2.
The following pointer class for the system:
1)
CFOPIndicatorNeedle
class
CFOPIndicatorNeedle defines a
simple
pointer, pointer parameters
PivotPoint set by the center.
Defines
a pointer enumeration FOPIndicatorNeedleStyle
various styles.
As shown below.
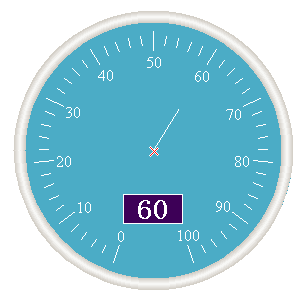
The
following figure shows an example of how to use
CFOPIndicatorNeedle the
fpKite style, the default angle is 60, the use
of
CFOPMeterEllipticalScale
oval plate.
The width of the pointer value
is set to 10.

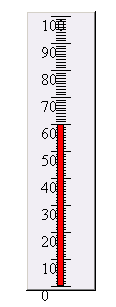
2)
CFOPIndicatorBar
Progress bar,
a rectangular
type
CFOPIndicatorBar real progress
bar, you can set the
maximum,
minimum,
as shown below.
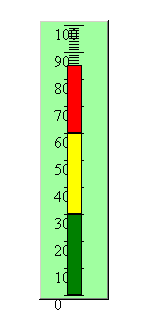
Class
defines a rectangle
CFOPIndicatorBar progress bar, you can display
different sub-values, set
by a class of Phase the maximum
value of each segment \ minimum and worth every
color, as follows:
3)
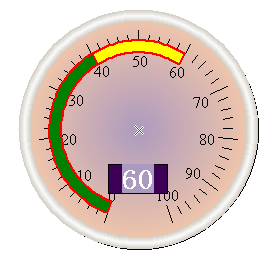
CFOPIndicatorElliptical
Oval
progress bar, the class
is to improve the degree of
CFOPIndicatorElliptical definition of Article
class.
As shown below.
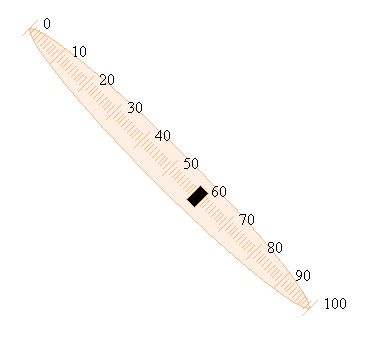
4) CFOPIndicatorSlider
Cursor pointer, class
CFOPIndicatorSlider is its
defining
class, itself is a box cursor
itself is derived from class CObject down so that it
can serialize or run-time type identification, you
can set the Pen and Brush.
Dimensions used to set the
size property.
Enumeration
FOPIndicatorSliderStyle defines the default style.
Including fpTriangles and
fpBar style.
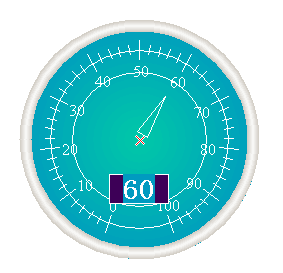
5) CFOPIndicatorKnob
Knob
pointer, CFOPIndicatorKnob
defines an oval-shaped knob pointer, pointer knobs
arc in the center of a small triangle, the color
property value
MarkerColor set a new class
derived from this class, you can re-customize the
look and feel.
|
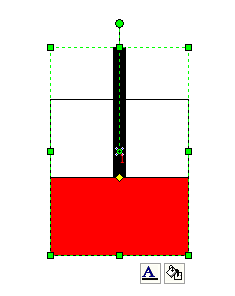
3. Piston shape:
4.
Advance shape:
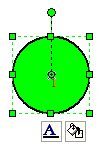
5.Animate flash ellipse shape:
6. Animate text control:

7. Tank shape:
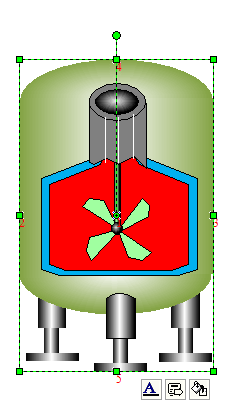
8. New tank shape:
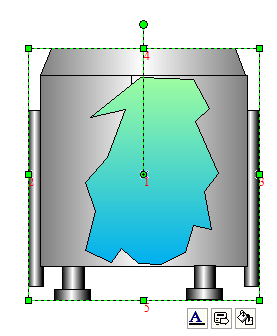
9. Advance real-time control:

10.
Pie progress control shape:
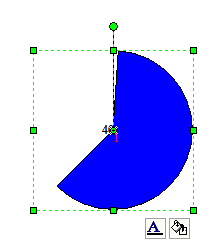
11. Animate line shape:
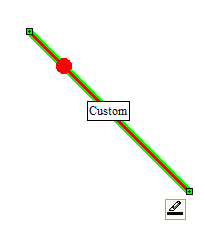
12. Real-time chart control:
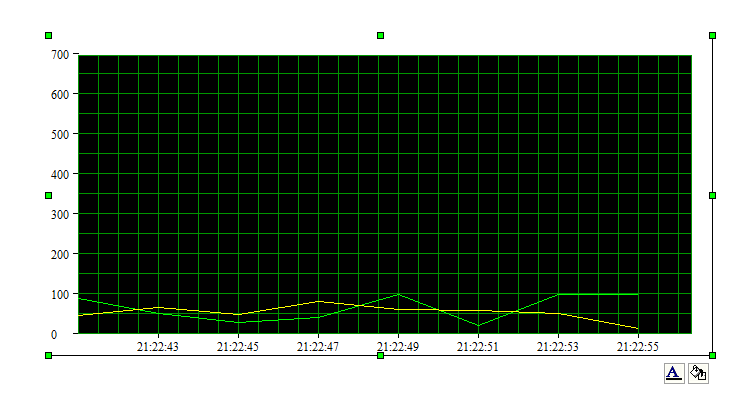
13.
New style switch control:
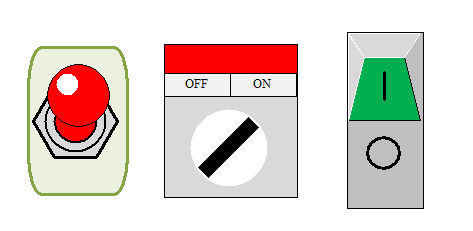
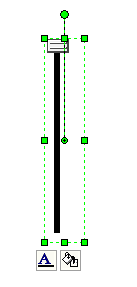
14. Vertical slider control:
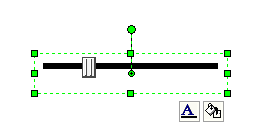
15. Horizontal slider control:
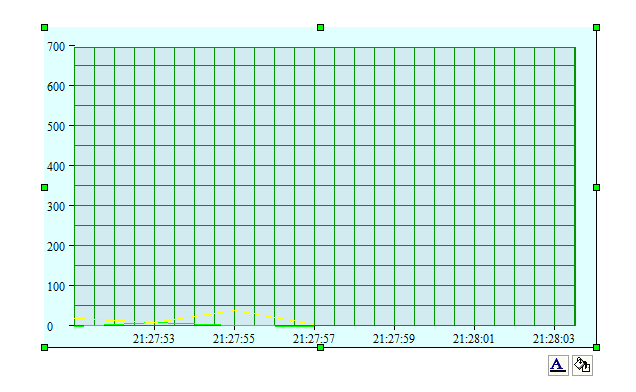
16. New style chart control:
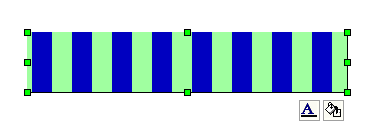
17.
Carry animate shape:
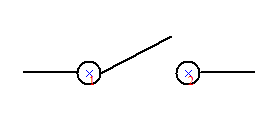
18. New style switch shape:
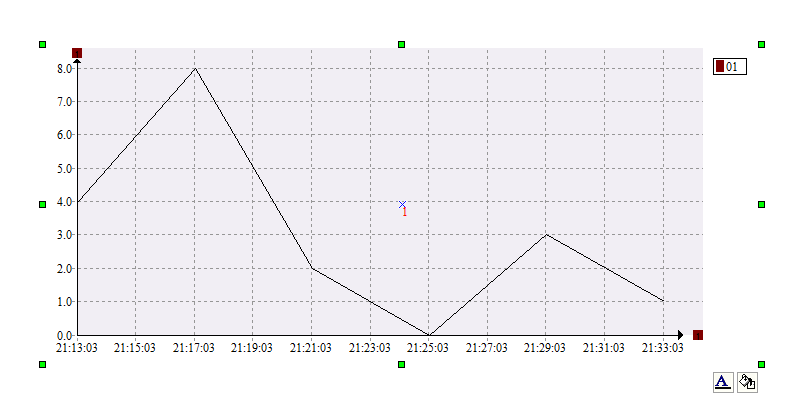
19. New style chart control:
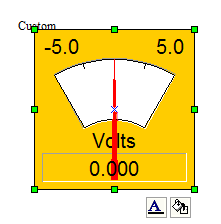
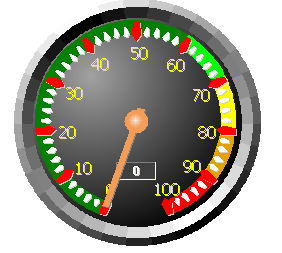
20, new style instrument 1
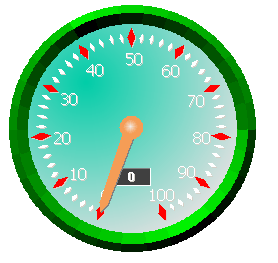
21,
new style instrument 2:
22,
New Style Instrument 3:
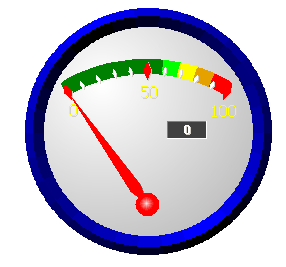
23,
New Style Instrument 4:
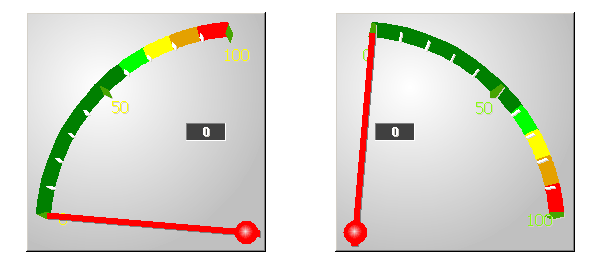
24,
New Style Instrument 5:
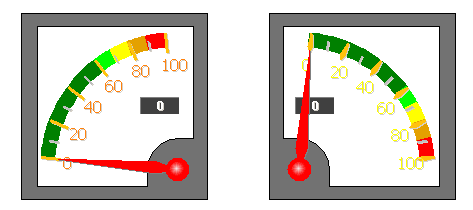
25,
New Style Instrument 6:
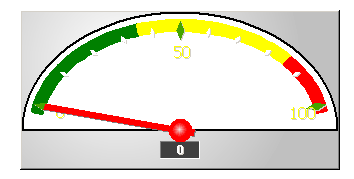
26,
New Style Instrument 7:
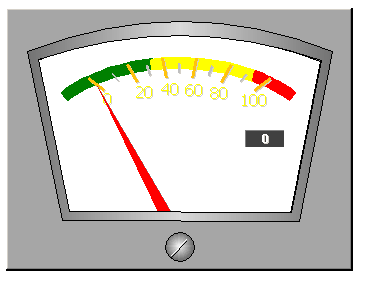
27,
New Style Instrument 8:
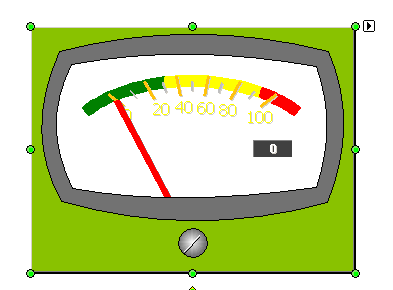
28,
new style knob 1:
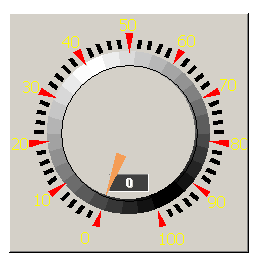
29,
new style knob 2:
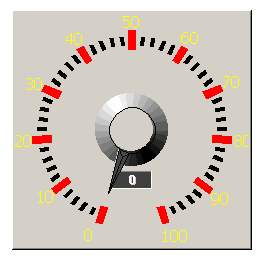
30,
new style knob 3:
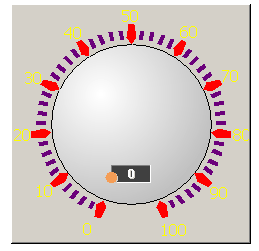
31,
New Style button 1:
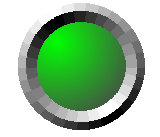
32,
New Style button 2:
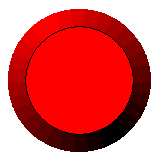
33,
if you want your style?
No
problem, direct contact with the
UCanCode, we help you create.
|
|
Here is the E-XD++
Visual Component Library source code
version control
system enterprise application development, the basic
steps:
1.
Design requires the monitoring system components:
This step can be E-XD++ provides ShapeDesigner
application to the design, this tool can directly be
Microsoft Visio or ConceptDraw other professional
graphics tools designed components into (SVG file)
came in with, of course, you can also ShapeDesigner
itself rich The basic graphic design needs to the
monitoring system components.
At design time, can
easily design directly to the canvas element by
Copy, Paste way to the left of the component into
the tool box, as shown below (Note: This
ShapeDesigner the source code itself, together with
the E-XD++ official version available, can be
customized as needed):
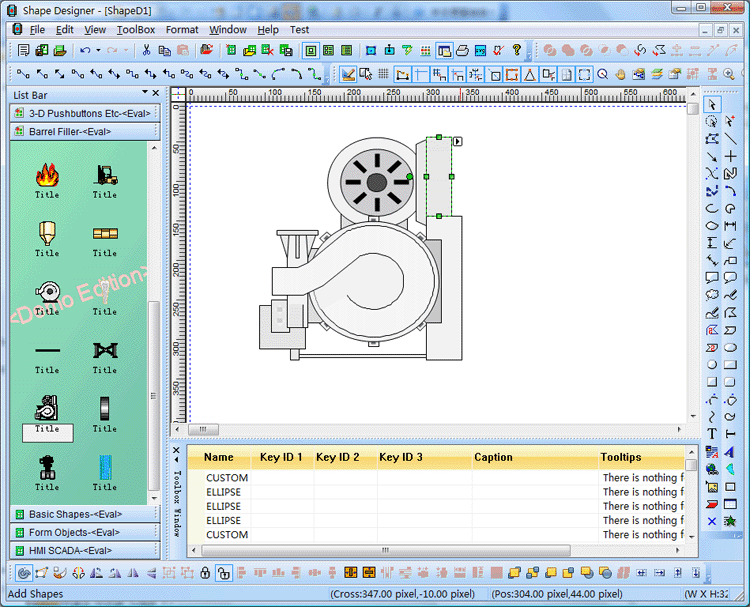
When we design
components of the composite components can also be a
single definition of a number of sub-components to
facilitate later identification and handling of the
Key ID values that can later obtaineirectly by
calling GetKeyID.
2. Design
monitoring system needs a graphical interface:
E-XD++ provides a special interface design tools
DiagramEditor, in this tool, we can easily apply the
above ShapeDesigner through a variety of monitoring
system components designed to build a graphical
interface.
Interface in the
structures, as required for specific components we
can specify the Key ID value, the Key ID value for
us in specific programs to control, for example, we
can control the switch off and open, lights flashing
and so on.
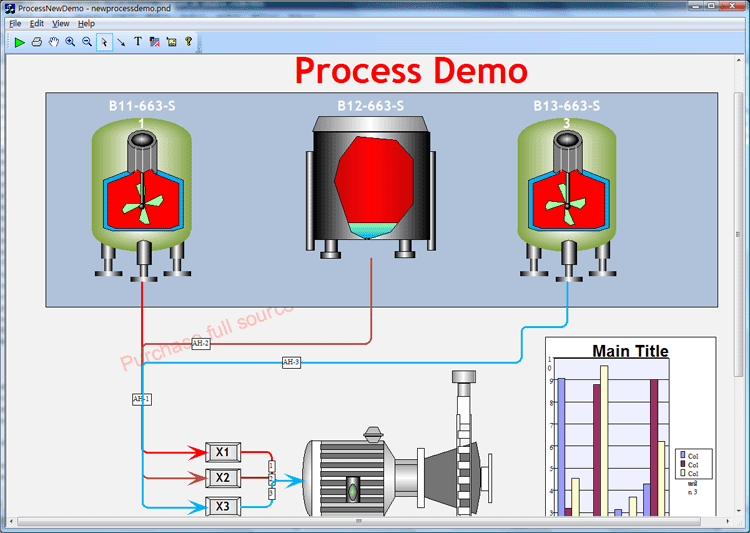
We designed a
graphical interface can be saved as a single xdg
file, as shown below: (Note: This DiagramEditor the
source code itself, together with the E-XD++
provides the official version can be customized as
needed):
3. Building
monitoring application:
By E-XD++
visualization component library provides
graphics
integrated in Visual Studio's AppWizard (Application
Creation Wizard) to automatically generate the
framework code control system can be designed for
the above We DiagramEditor xdg files into this
program as resource file, when we need to load a
design interface when calling the following
function:
LoadXdgFromResource (...); if we need to switch to
the new interface, you can also call the function to
load the new interface.
Reference sample
NetworkDemo.
4. Animation and
real-time data processing:
External data
acquisition we can View the Window class or classes
of timer to be collected, when the need to update
the interface when the status of the components can
be designeirectly above us to get the Key value
of the graphic elements or sub-component graphics.
5. Transaction
processing:
By overriding the
appropriate virtual function to time a variety of
transaction processing, for example, we only need to
cover the following virtual functions CFOPCanvasCore
class to respond to button events:
virtual voioButtonClickEvent(CFODrawShape *pShape, const int
&nSel);
virtual voioButtonClickEvent (CFODrawShape *
pShape, const int & nSel);
The
actual instrument in the development of the graphics
the graphics needs of your current class from the
class or subclass CFODrawShape deriveown, the
derived class itself will serve as the instrument
graphics context to use, so the specific
choice of which class to be derived, mainly to see
Which of your instrument similar to close some of
the background graphics. In addition you need to
define a derived class, the class scale, the general
class
CFOPMeterScale
directly or class
CFOPMeterEllipticalScale,
of course, you can use these classes themselves,
but also to create the next for a new means to, you
can choose from the category
CFOPIndicatorBar, CFOPIndicatorElliptical,
CFOPIndicatorSlider, CFOPIndicatorSliderElliptical,
CFOPIndicatorNeedle, or create one of the
CFOPIndicatorKnob
to can.
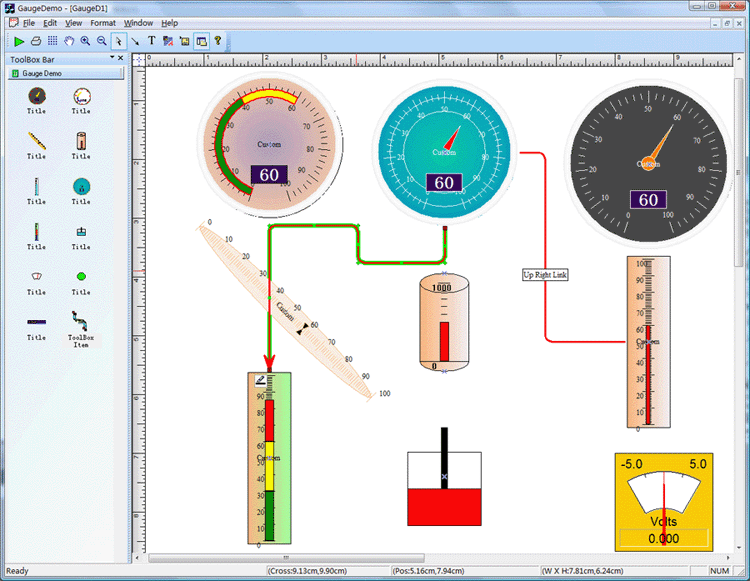
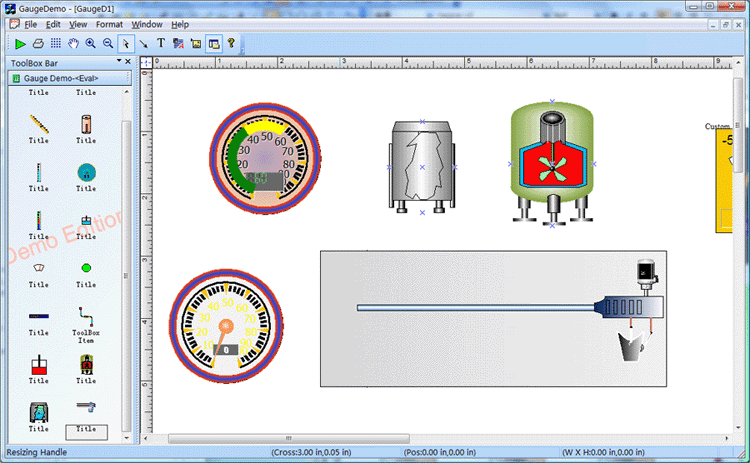
GaugeDemo
Everything this way, see the sample program:
GaugeDemo
All the instruments need the full assembly of the
parts, any part of the derived class, or by
overloading virtual functions to be expanded and
customized. The background of the instrument you can
use any E-XD++ Enterprise Edition provides the
graphical components to form Of course, you can also
use
graphics to create a composite style of the
ever-changing instrumentation, reference example:
GaugeDemo, as follows:
E-XD++ visualization
component library to any graphics on the canvas are
set to start the timer function independently, which
means that as long as you want to move up a graph
can be allowed to move, which for the development of
any advanced industrial control and simulation
application provides the most direct solution.
There are also
features of the system:
 |
100% MFC
design, and provides all the
source code,
without reservation.
|
 |
Effective more
than 500,000 line of code, and more than
500 C ++
extension classes.
|
 |
Automatic code
generation process, and complete the
development of documentation to help you
quickly build a variety of applications on
E-XD++.
|
 |
Development of
advanced application systems to provide
complete and scalable interface control.
|
 |
Property line
of code changes and provide support for Undo
/ Redo function.
|
 |
Users on the
canvas according to their needs, components,
operation, and other custom operations.
|
 |
Supports both single page or multi-page
application.
|
 |
The layout of
the components, layout, organized in the
order.
|
 |
Print, print
preview and output to the image.
|
 |
Draw a
straight line, mark lines, curves,
rectangles, ellipses, add text, and
pictures.
|
 |
Provide more
than 80 examples of various development
programs.
|
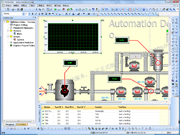
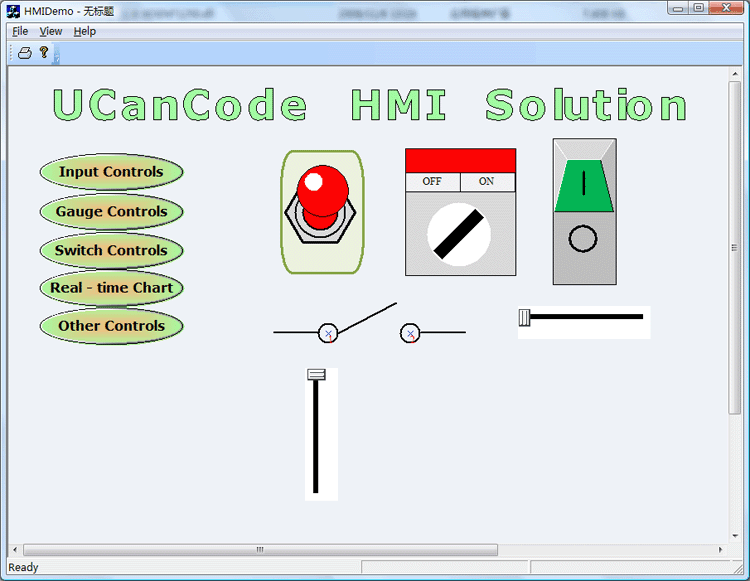
HMI Demo example
shows how to define a simple multi-page industrial
control interface, as follows:
More
than 500 thousands lines all carefully designed and
rigorously tested to provide the source code without
any reservations!
Provide more than 400
class C ++ extensions, 500 thousands lines of
effective VC ++ / MFC source code, sample or
solution more than 70 source code, complete anetailed online help system and user documentation,
supporting development tools designed!
Powerful, flexible
and easy to use graphical visualization of source
code libraries.
Powerful and flexible
to create a variety of charts to meet your needs.
Product design
specifications, it is easy to use, in just a few
days can be designed according to your needs
products.
We provide complete
support for products, download the trial.
Feature-rich.
Ultra-versatile, such
as automatic layout, multi-level collapsible
subgraph, cell connection point, XML, DXF, SHP, SVG,
etc., can help you quickly create complex and
flexible chart.
Supports a number of
events: such as click, double click, hover, select,
rubber band select, copy, delete, resize and move
the support.
Support the most
complex operations: such as drag anrop, unlimited
undo / redo and clipboard operations and so on.
Save time and money
to obtain reliability.
A picture is worth a
thousand words, E-XD++ offer more than 500
thousands
lines of well-designed and well-tested
C ++ source
code!
Development takes
years, thousands of customers worldwide validation,
can save you a lot of development time and money!
Try it now!
Do not just listen to
us say it a try!
Our free trial
includes all you need to prototype your application.
Free technical
support.
 Products
 Download this
solution

 The official version of the E-XD++ component library visual
graphics
solutions for enterprise version provides all the
source code, click the button below to order from
UCanCode
:

News:
1 UCanCode Advance E-XD++
CAD Drawing and Printing Solution
Source Code Solution for C/C++, .NET V2025 is released!
2
UCanCode Advance E-XD++
HMI & SCADA Source Code Solution for C/C++, .NET
V2025 is released!
3
UCanCode Advance E-XD++ GIS SVG Drawing and Printing Solution
Source Code Solution for C/C++, .NET V2025 is
released!
Contact UCanCode Software
To buy the source code or learn more about with:
Recommended (with
E-XD++ IPC and configuration solutions and GIS
solutions for Gis more powerful features):
|
|
|
|
 |
|
|
|
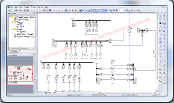
The MATLABDemo sample
demonstrates how to use E-XD++ to build a matlab
like diagramming application with complex diagram
drawing and layout, as below.
|
 |
 |
|
|
|
|
|


